Klaviyo Reports in Google Sheets That Build Themselves
Weekly campaign recaps, flow performance reviews, client reports — most Klaviyo reporting ends up in a spreadsheet anyway. This guide shows how to get every metric into Google Sheets once, and have it refresh on a schedule from then on.
The metrics you get
SheetPort for Klaviyo writes each dataset into its own tab, one row per campaign or flow:
| Tab | Columns |
|---|---|
| Klaviyo Campaigns | Campaign name, send date, recipients, open rate, click rate, conversions, revenue, AOV |
| Klaviyo Flows | Flow name plus the same performance metrics |
| Klaviyo Profiles | Email, name, phone, location, created date — full list, chunked automatically for 10,000+ profiles |
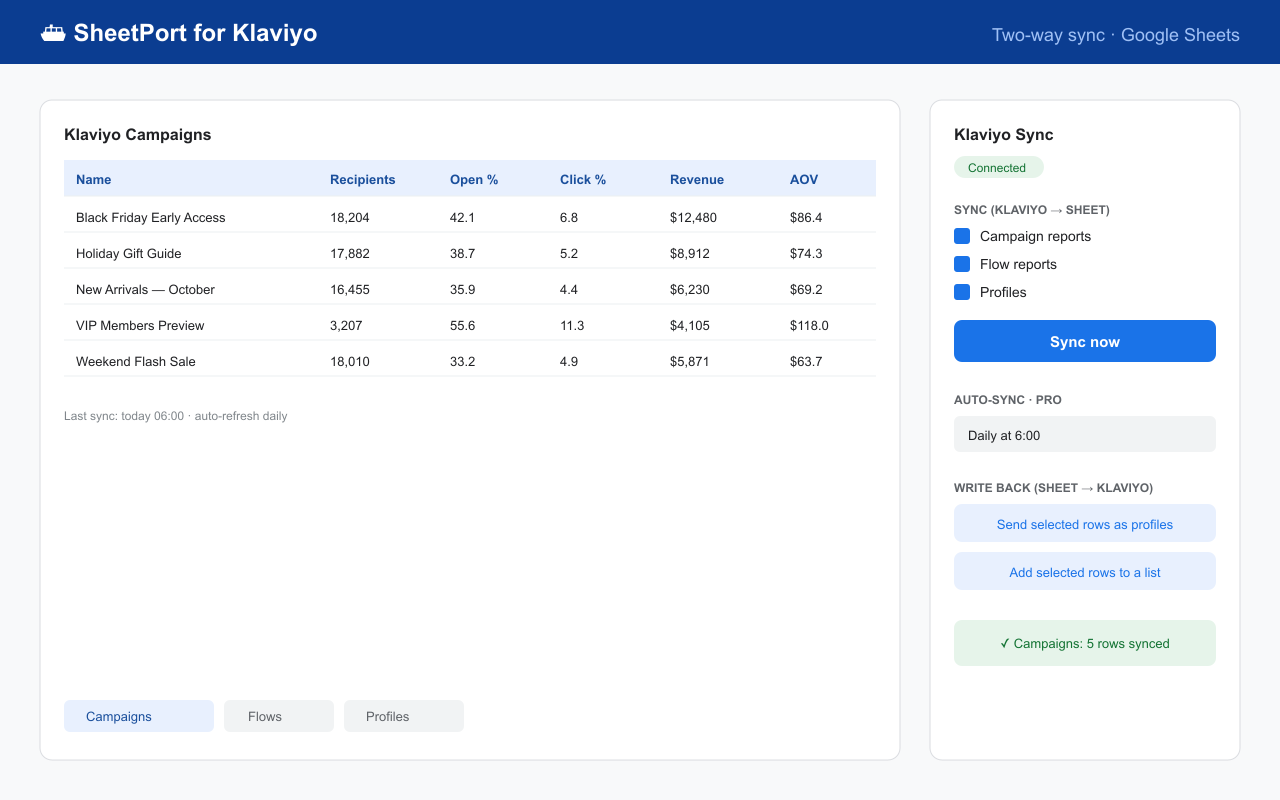
Because the data tabs are plain rows, everything you already know in Sheets applies: QUERY, VLOOKUP, pivot tables, sparklines, conditional formatting, and charts that feed Google Slides.
Recipe: a Monday-morning report that builds itself
- Install and connect — get the add-on from the Marketplace, open Extensions → SheetPort for Klaviyo → Open, paste a scoped API key (setup guide).
- Sync campaigns and flows — first sync creates the data tabs.
- Build your report tab — add a separate tab with your formulas: last week's sends via
QUERY, revenue per campaign, open-rate trend charts. SheetPort only rewrites its own data tabs, so your report tab survives every refresh. - Turn on scheduled auto-sync (Pro) — set daily refresh in the sidebar. By Monday 9am the numbers are already current.
- Share the sheet — teammates and clients get a live report without ever logging into Klaviyo.
IMPORTRANGE.Why report in Sheets instead of Klaviyo's dashboard?
Klaviyo's built-in analytics are fine for a quick look, but spreadsheets win when you need to: blend email metrics with ad spend or store data, compute custom KPIs (revenue per recipient, list growth vs. campaign frequency), keep a historical archive beyond the dashboard's view, or hand a client a report they can open without a Klaviyo login.
The alternative — re-exporting CSVs every week — is exactly the loop this replaces. See the full export comparison and why teams drop manual CSV exports.
Bonus: your report can talk back
Reports built with SheetPort are not read-only. Spot a segment of high-value customers in your analysis? Select those rows and push them back to Klaviyo as a list or profile update — analysis and action in the same sheet.
Google Workspace™ Marketplace · Free plan · Scheduled refresh on Pro ($19/mo)
SheetPort is an independent product and is not affiliated with or endorsed by Klaviyo. Klaviyo is a trademark of Klaviyo, Inc. Questions: [email protected]